Bulk kitchen machinery can look economical on purchase day. The invoice may show a strong unit price, but later service bills tell a different story. A failed door gasket, clogged burner, loose hinge, or damaged control board can stop several workstations at once. Downtime also wastes ingredients, staff hours, and scheduled orders.
This guide explores How to reduce later repair cost of bulk purchased kitchen machinery through practical planning. Mike O’Neill, a veteran commercial-foodservice equipment service manager, states, “The cheapest machine is rarely the cheapest machine to own.” That view matters when kitchens purchase twenty ovens, mixers, fryers, or refrigeration units together. Standardized models can simplify training and spare-part storage. They can also create shared risk when one design has a recurring weakness.
A reliable approach begins before delivery. Buyers should review service records, warranty limits, installation requirements, and local technician coverage. Water hardness deserves attention. So do ventilation, electrical load, floor levels, and daily cleaning routines. A poorly installed combi oven may develop faults long before its expected life. Small details matter.
Record each serial number. Photograph connections and control panels. Keep common seals, filters, fuses, and approved lubricants nearby. Train operators to report unusual noise, heat, vibration, or error codes immediately. Delayed reporting is expensive.
Some assumptions need testing. Buying one brand may reduce complexity, but it may not provide the best reliability everywhere. A low purchase price may also hide costly parts. Careful comparison remains necessary. The goal is not to eliminate every repair. That is unrealistic. The goal is to make repairs predictable, limited, and easier to complete.
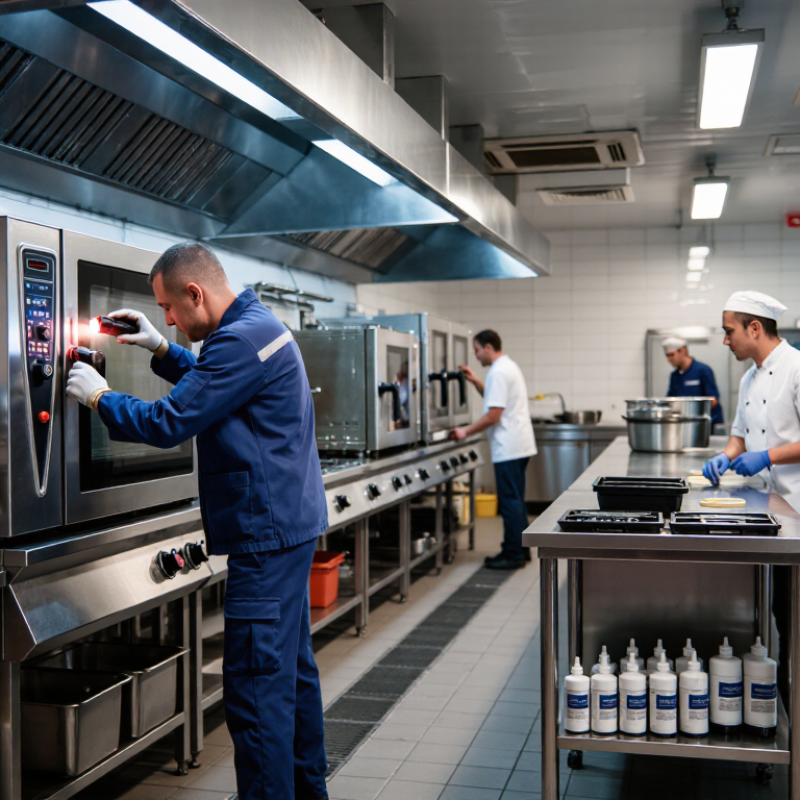
The National Restaurant Association places typical restaurant profit margins near 3–5%. That narrow margin makes every equipment repair financially important. A single failed mixer can create labor delays, spoiled ingredients, and emergency service charges. Managers should calculate repair spending against monthly sales, not guess from isolated invoices.
Build a cost baseline for each machine. Record purchase date, operating hours, service history, replacement parts, and downtime. Include smaller expenses, such as seals, filters, calibration, and technician travel. A spreadsheet can reveal that repeated minor repairs cost more than planned component replacement. It is not always obvious.
Review the numbers every quarter. Set an alert when annual repairs approach 10–15% of replacement value. This figure is a planning guide, not a universal rule. Heavy-use kitchens may need a lower threshold. Clean machines after production, inspect loose fittings, and train staff to report unusual noise early. These actions reduce avoidable damage, but they cannot prevent every failure. A rushed inspection can miss a worn bearing. That is a useful warning. Maintenance records should also show who inspected the machine and what they observed. Clear records support better budgeting and more reliable decisions.
Repair budgets for bulk kitchen machinery often fail because every asset receives equal attention. ISO 55000 supports a structured asset-management approach, but it does not prescribe one fixed scoring formula. A practical risk score can combine failure likelihood, downtime impact, and repair cost.
Use a simple one-to-five scale for each factor. A mixer with frequent bearing failures may score 4 for failure likelihood. If it stops a preparation line for six hours, downtime may score 5. Its repair cost could score 3. Multiplying or weighting these values creates a transparent priority score. Keep the method consistent.
Real maintenance records matter more than assumptions. Review work orders, spare-part invoices, stoppage logs, and technician observations. A machine may appear inexpensive to repair, yet cause costly production delays. Another asset may have frequent minor faults but little operational impact. That distinction changes the ranking.
High-scoring equipment deserves condition checks, critical spares, and planned intervention. Low-scoring assets can remain on routine inspection schedules. Review scores after seasonal demand, process changes, or repeated failures. Data can be incomplete. That is normal. However, hiding uncertainty makes the ranking less reliable. Record confidence levels beside each score, and question dramatic results before approving major spending. A spreadsheet is useful, but disciplined judgment remains essential.
Reducing repair costs for bulk kitchen machinery starts before a breakdown. Preventive maintenance replaces emergency work with planned inspections, measured adjustments, and timely part changes. Industry maintenance reports indicate that predictive programs can reduce downtime by 30–50%. The result depends on disciplined execution, not software alone.
Technicians can monitor motor vibration, bearing temperature, electrical current, and unusual operating noise. A rising temperature near a conveyor gearbox may reveal poor lubrication or a failing seal. Inspect blades, belts, gaskets, valves, and heating elements during scheduled service. Record readings after every inspection. Clear records help teams compare normal performance with early warning signs.
Small problems matter. A loose belt can damage several connected parts. However, every alert does not require immediate replacement. Sensors can drift, and busy kitchens may collect incomplete data. Each warning should be checked by an experienced technician before approving expensive work. That human review is easy to overlook. It should not be.
Maintenance teams should set practical thresholds and review them monthly. Keep critical seals, belts, bearings, and fuses in controlled stock. Train operators to report slower heating, uneven mixing, leaks, or new sounds. These details often appear days before failure. A predictive plan may begin imperfectly, with missing readings or incorrect limits. Regular audits can correct those weaknesses while keeping repair decisions evidence-based.
Use preventive maintenance to identify equipment problems before they become costly breakdowns.
Industry reporting indicates that predictive maintenance programs can reduce equipment downtime by approximately 30–50%. Lower downtime can help reduce emergency repairs, production interruptions, and related operating costs.
Reducing repair costs for bulk kitchen machinery starts with controlling parts and labor data. Track mean time to repair (MTTR) for each mixer, cooker, slicer, and conveyor. Record the time from fault confirmation to safe production restart. Include diagnosis, parts waiting, cleaning, and testing. Otherwise, the number looks better than reality.
Track mean time between failures (MTBF) beside MTTR. MTBF shows how often equipment fails during operating hours. A low MTBF with a low MTTR still creates disruption. A high MTBF with a long repair may reveal poor access or weak spare-parts planning.
Use a simple maintenance log with failure codes, labor hours, component costs, and downtime minutes. Keep the details specific. “Motor problem” is not enough.
Compare results with relevant SMRP maintenance benchmarks, but do not treat them as universal targets. Asset type, workload, sanitation routines, and equipment age change the baseline. Review trends monthly, then investigate the largest cost gaps. Our first dashboard was misleading because technicians entered labor time after cleanup. That mistake hid nearly an hour per repair. We corrected the form, but the data still needs review. Numbers require judgment. Keep critical parts near the line, standardize inspection steps, and train technicians on recurring failure modes. Small improvements in diagnosis can reduce overtime, emergency purchasing, and repeated breakdowns.
Restaurants often use five to seven times more energy than other commercial buildings, according to ENERGY STAR. That gap makes kitchen equipment more than a repair concern. It becomes a daily operating cost.
Bulk cooking machines may run through long service hours. A worn door seal, weak heating element, or clogged filter can increase electricity use before failure appears. In a busy kitchen, the unit may still produce food, but slowly and inefficiently. That hidden strain can raise utility bills and shorten component life.
Track energy patterns beside repair records. A sudden increase in power use deserves inspection, even when output seems normal. Compare repair frequency, downtime, replacement parts, and annual energy costs. A low-cost repair may be sensible for a newer machine. An older unit with repeated faults may justify replacement sooner.
Timing is not always obvious. Staff habits, cleaning quality, ventilation, and workload also affect consumption. We should not blame the machine too quickly. Still, delaying action can be expensive. A practical review every few months helps managers spot equipment that is becoming costly to keep. One overlooked warning sign is enough.
MTTR measures repair time from confirmed failure to safe production restart. Include diagnosis, parts waiting, cleaning, and testing.
MTBF shows how often equipment fails during operating hours. Low MTBF still causes disruption, even when repairs are quick.
Record failure codes, labor hours, component costs, and downtime minutes. “Motor problem” is too vague.
Technicians may enter labor time after cleanup. Our dashboard hid nearly an hour per repair.
No. Equipment age, workload, sanitation, and asset type change the baseline. Compare trends carefully.
Repeated faults, rising energy use, frequent parts purchases, and long downtime are important signals.
Yes. A worn seal, weak heating element, or clogged filter may slow production first.
Cleaning quality, staff habits, ventilation, and workload also affect consumption. Do not blame the machine too quickly.
Review them every few months, then examine major cost gaps. Monthly trend checks are better for maintenance data.
Keep critical parts near the production line. Standardize inspections and train technicians on recurring failure modes. Small fixes matter.
Reducing repair costs for bulk kitchen machinery starts with a clear cost baseline. Since restaurant profit margins are often narrow, owners should evaluate each machine by purchase price, operating impact, repair history, and potential revenue loss from downtime. Use risk scores that consider failure likelihood, downtime duration, and repair expense to prioritize essential assets. High-risk equipment should receive more frequent inspections and faster service responses, while lower-risk units can follow a simpler maintenance schedule.
Preventive and condition-based maintenance can significantly reduce unexpected breakdowns and downtime. Track mean time to repair, mean time between failures, labor hours, and parts usage to identify recurring problems and improve purchasing decisions. Keep critical spare parts organized, compare supplier and labor costs, and train staff to report early warning signs. Finally, review whether aging equipment should be repaired or replaced by comparing repair frequency, energy consumption, and expected service life. This approach explains How to reduce later repair cost of bulk purchased kitchen machinery while improving reliability and long-term operating efficiency.

Linru Kitchen Equipment